Template Looker Studio for Data Analysis Retail & SaaS
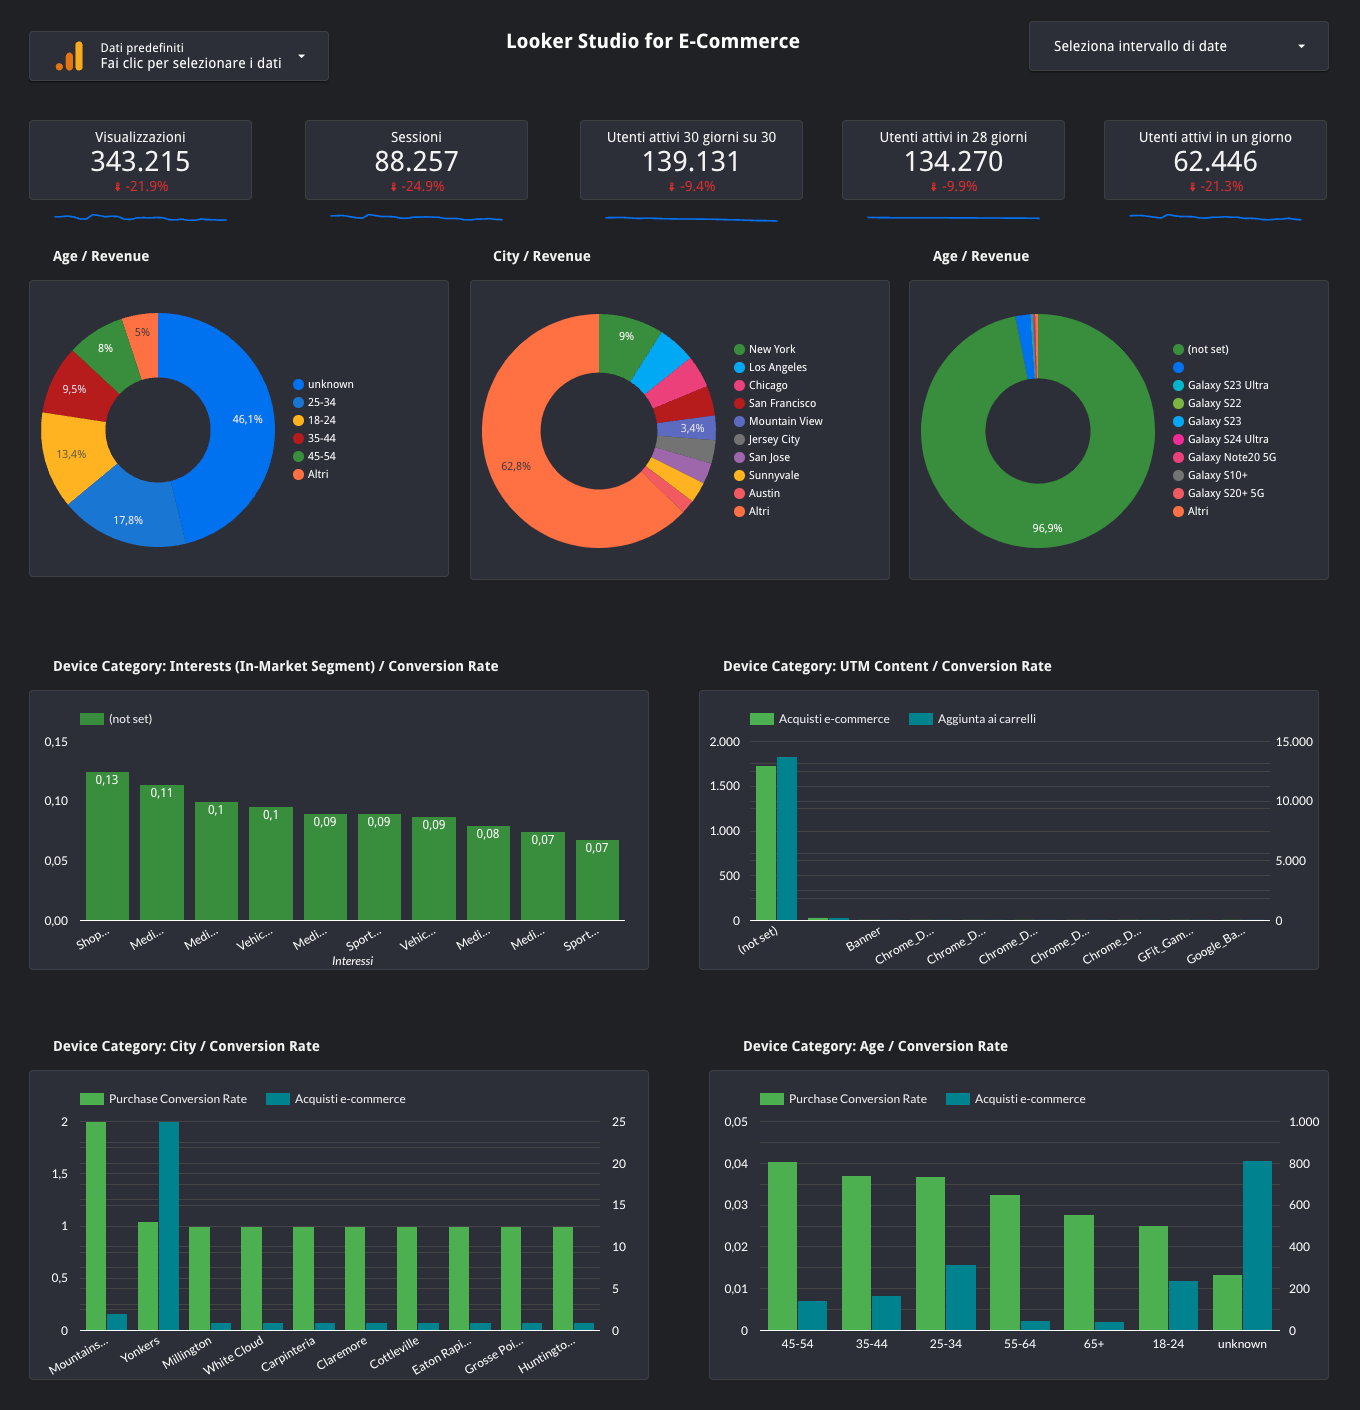
In every dashboard, the KPIs and how to read them are explained. Each chart or table is linked between them to enable filters and drill down into your data.
It's an assets collection of the Looker Studio dashboard I usually use in consultancy programs. Once connected to your data, they continuously update and show deeper insights into your e-commerce.
Advanced Dashboard for Retail
This one-page dashboard can enable you to understand easily:
- WHEN and WHERE you have to roll out the retargeting ads
- WHO and WHERE you have to target in your marketing ads
- WHAT and HOW are you earning with your business
- WHAT are the customers and DEVICES you're winning

How to do
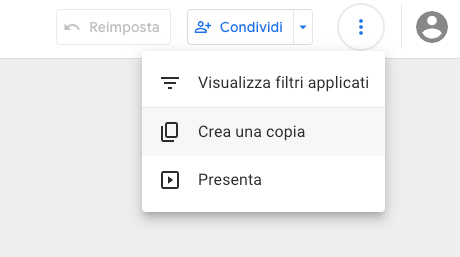
- Create a copy of this dashboard, clicking the three dots in the top right corner.

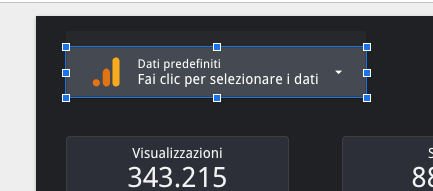
- Connect it with your Google Analytics by clicking on the top left corner dropdown.

- Playground!
